
Key Takeaways
- Client financials only show half the picture. Industry context reveals whether performance reflects company strength or broader market conditions, catching risk signals that financials alone miss.
- The same industry data supports different teams differently: relationship managers use it to build credibility in pitches, credit teams use it to flag outliers, and risk leaders use it to stress-test portfolio exposure.
- The real advantage isn't just having industry data. It's removing the "swivel chair" problem by building that data directly into tools bankers already use, like Snowflake, nCino, and AI platforms such as Claude.
Commercial banks have no shortage of client information.
Despite an abundance of information, many banks still face a fundamental challenge:
How do you understand a client's performance without understanding their market?
Better lending decisions start with better context
The client data that bankers have only looks at the client’s performance in isolation: how revenue changed, what products they hold, how they've borrowed and repaid. What it often misses is whether that performance reflects company-specific factors or broader industry conditions.
“C±ô¾±±ð²Ô³Ù data tells you what a business did. Industry analysis tells you what that result actually means.â€�
Credit risk teams routinely analyze financial performance, leverage, cash flow and repayment capacity. These are critical metrics, but industry conditions often provide essential signals about future performance and resilience that financials alone miss.
Consider two construction companies with similar financials. On paper, they look equally creditworthy. In reality, their risk profiles diverge depending on where demand is coming from.
Company A is focused on data centers and AI-driven infrastructure, where hyperscale data center services revenue has grown at a 30.1% CAGR over the past five years, with 26.5% growth expected in 2026. Company B is focused on suburban office developments, where commercial building construction has expanded at a much slower 2.2% CAGR, with growth of just 1.1% this year.
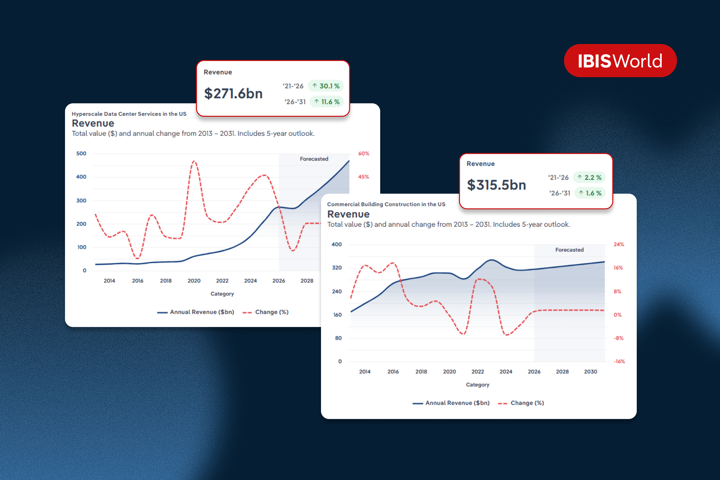
Despite similar historical financials, these two borrowers carry very different forward-looking risk profiles: Company A benefits from sustained demand and predictable cash flows, while Company B faces greater exposure to structural headwinds.
Industry context sharpens traditional credit analysis. It distinguishes temporary performance from structural positioning and reveals emerging pressures before they show up in the financials.
That same principle applies across departments.
How commercial banking teams apply industry insight
Relationship managers and business development
Front-office teams need to build credibility quickly and identify the right opportunities.
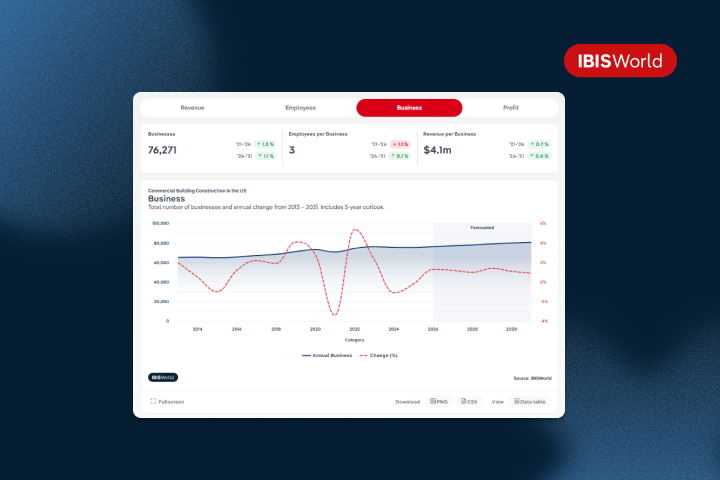
If you walk into a meeting with your prospect’s 5-year industry revenue forecast and a sense of how they compare to their industry's average, you start the conversation from a position of value instead of trying to pitch them your services. That's the shift: from generic product discussions to advisory conversations grounded in third-party data.
Credit risk and underwriting
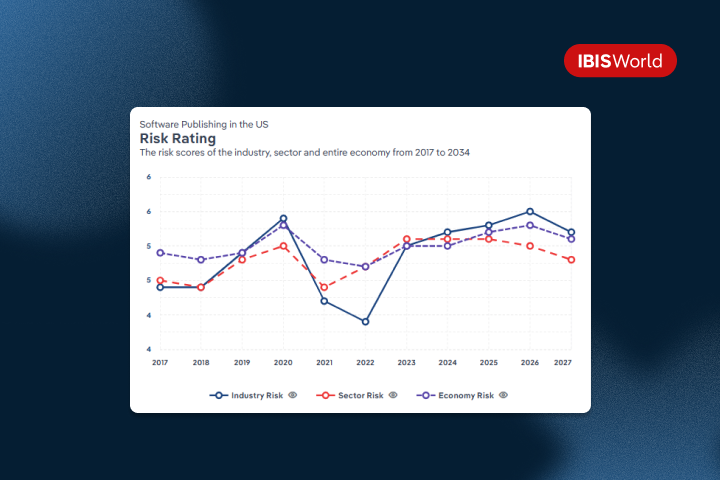
Credit teams need consistent, data-driven methods to assess borrower risk within the context of their industry: screening industries with standardized risk scores and early warning indicators, then comparing individual borrowers against those norms to flag outliers before they become problems.
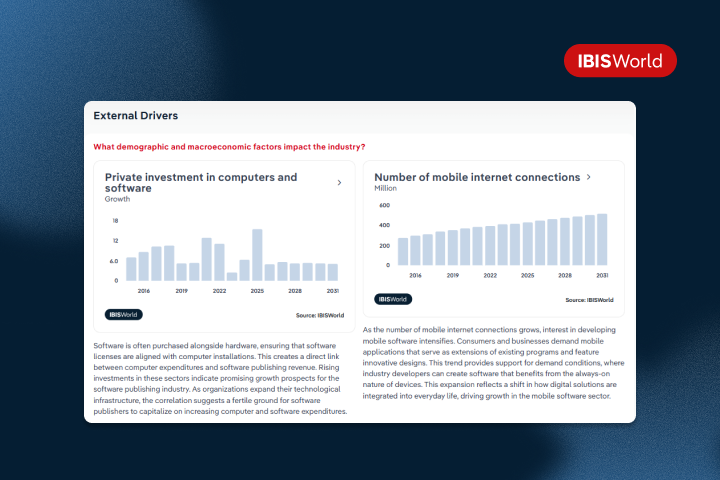
Layering in macroeconomic demand data adds a forward-looking check most credit models miss. The result is more consistent lending decisions, earlier outlier detection and credit assessments strengthened by industry context.
Portfolio risk and exposure management
Risk leaders need visibility into concentration risk and exposure across the loan book.
Mapping portfolios to industry classifications surfaces where that concentration sits, and segmenting exposure by revenue volatility shows which parts of the book are most exposed to a downturn. Stress-testing against macroeconomic shifts using demand driver data completes the picture, creating a forward-looking view of risk that helps banks identify vulnerabilities before they materialize.
The access problem
Understanding the value of industry context is the easy part. Getting it in front of the right people at the right time is where it gets tough.
Industry research has traditionally been done in research portals, using reports and databases. This is still a valuable method, but it’s a step removed from where banking teams actually do their work.
A relationship manager prepping for a client call, or an analyst working through a credit memo under deadline, may not have time to log into a separate platform to track down a data point. Jumping between tabs to track down a revenue figure then plug it in somewhere else is just too time-consuming.
This is often called the “swivel chair� issue. When you switch back and forth between platforms to complete a task, wasting time and effort.
The solution? Put the data where you already work.
Building industry context into the tools bankers already use
The fix is to stop treating industry context as a separate resource and start building it into the tools and systems teams use every day. Businesses become more efficient and impact ROI when verified data is already plugged into their ³Ù±ð²¹³¾²õ’ day-to-day workflows.
One of 91¶¶Òù’s commercial lending clients swapped the “swivel chairâ€� for a smarter, more integrated process. They mapped their portfolio to 91¶¶Òù’s industry database within their , enabling the risk team to monitor sector exposure and apply industry risk scores and revenue volatility indicators across their book.
With this mapping in place, as macroeconomic conditions began shifting, the lender was able to identify that a small number of industries were driving a disproportionate increase in portfolio risk, not because of borrower-specific deterioration, but due to weakening industry fundamentals. This insight enabled earlier intervention, more targeted exposure management and better-informed credit decisions.
Bring industry context into your workflow
Are you ready to understand your clients in the context of their market? 91¶¶Òù makes it easy to put the industry data you need where you already work.
nCino: benchmarks and risk data surface inside the credit workflow as a memo is built, with no manual sourcing required.
Snowflake: industry data sits alongside your own portfolio data as a live data share, queryable without a separate pipeline.
API: powers integrations for proprietary underwriting tools, internal dashboards and custom credit workflows.
AI integrations (MCP): 91¶¶Òù operates as a verified source layer within Claude, Copilot and ChatGPT.
Not sure which option is right for your business? Talk to our team